Hey There!
I'm Hena Yaqubi
Data Analyst turning raw data into clear dashboards and actionable insights
I build reports, dashboards, and analysis projects using Excel, SQL, Tableau, Power BI, and Python.
Open to junior data analyst roles, dashboard projects, and reporting work.
Featured Projects
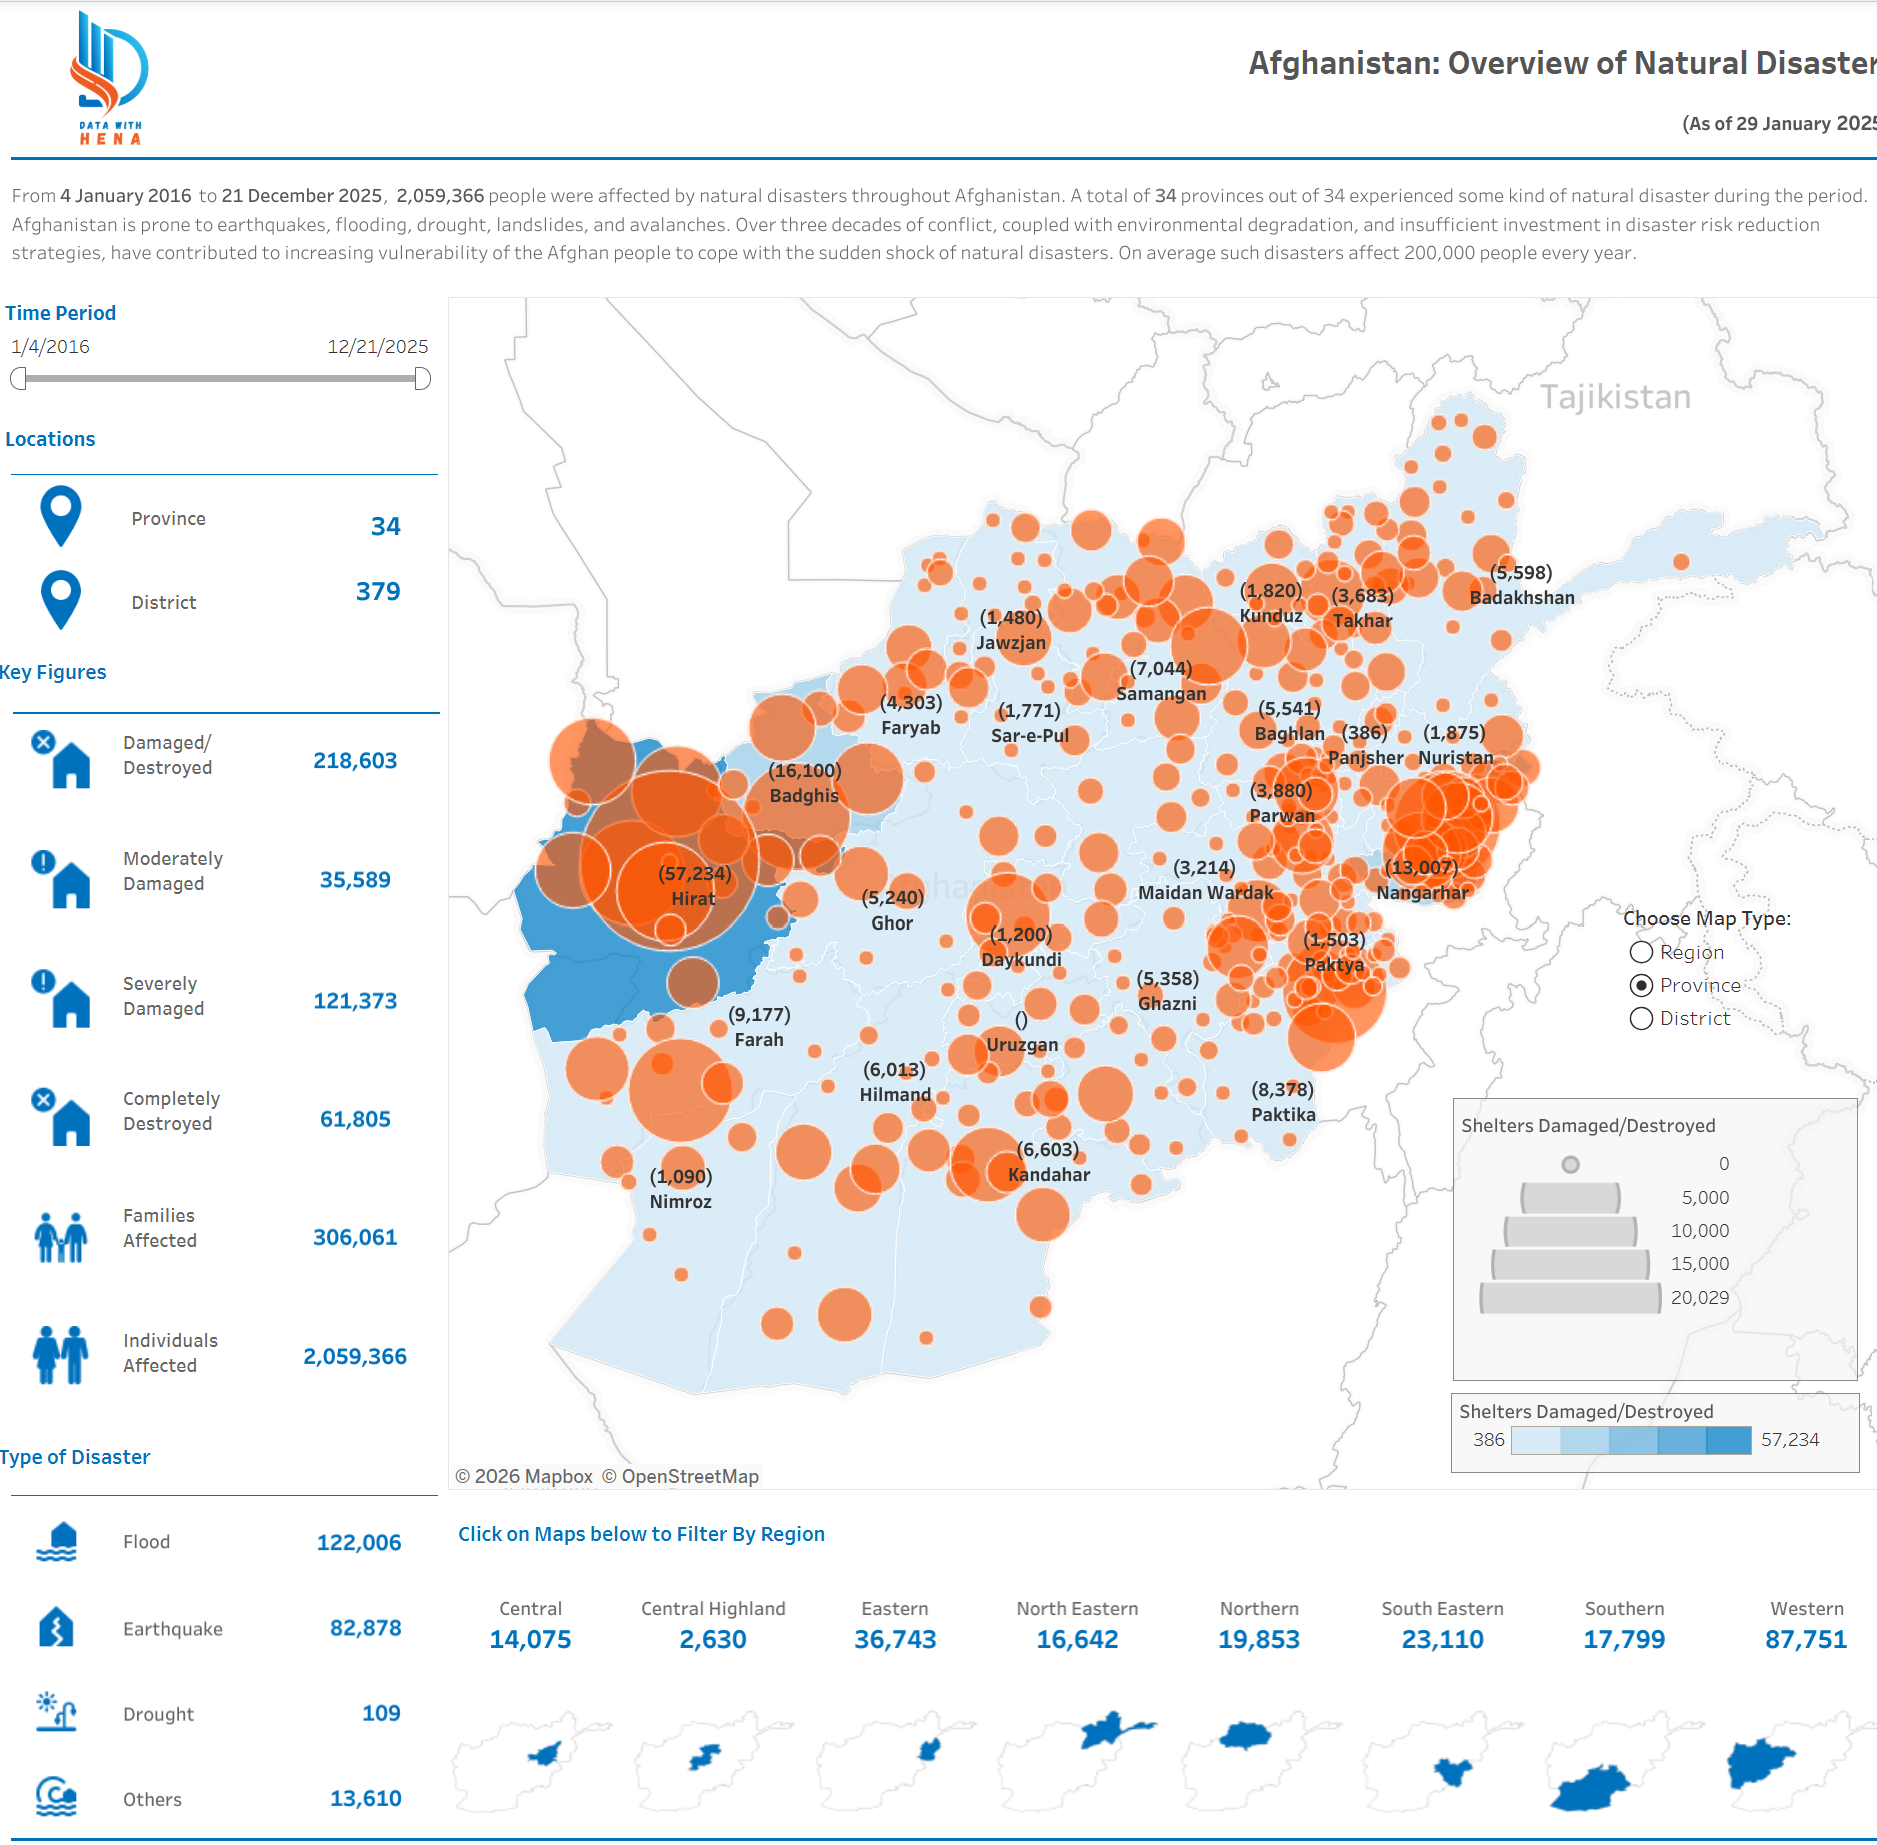
Afghanistan Natural Disasters Dashboard
Problem: Stakeholders needed a clear view of disaster patterns across Afghanistan for planning and response.
Tools: Tableau.
What I did: Built an interactive geographic dashboard with filters by disaster type, location, and time.
Key result: The dashboard highlights high-risk regions and recurring disaster trends at a glance.
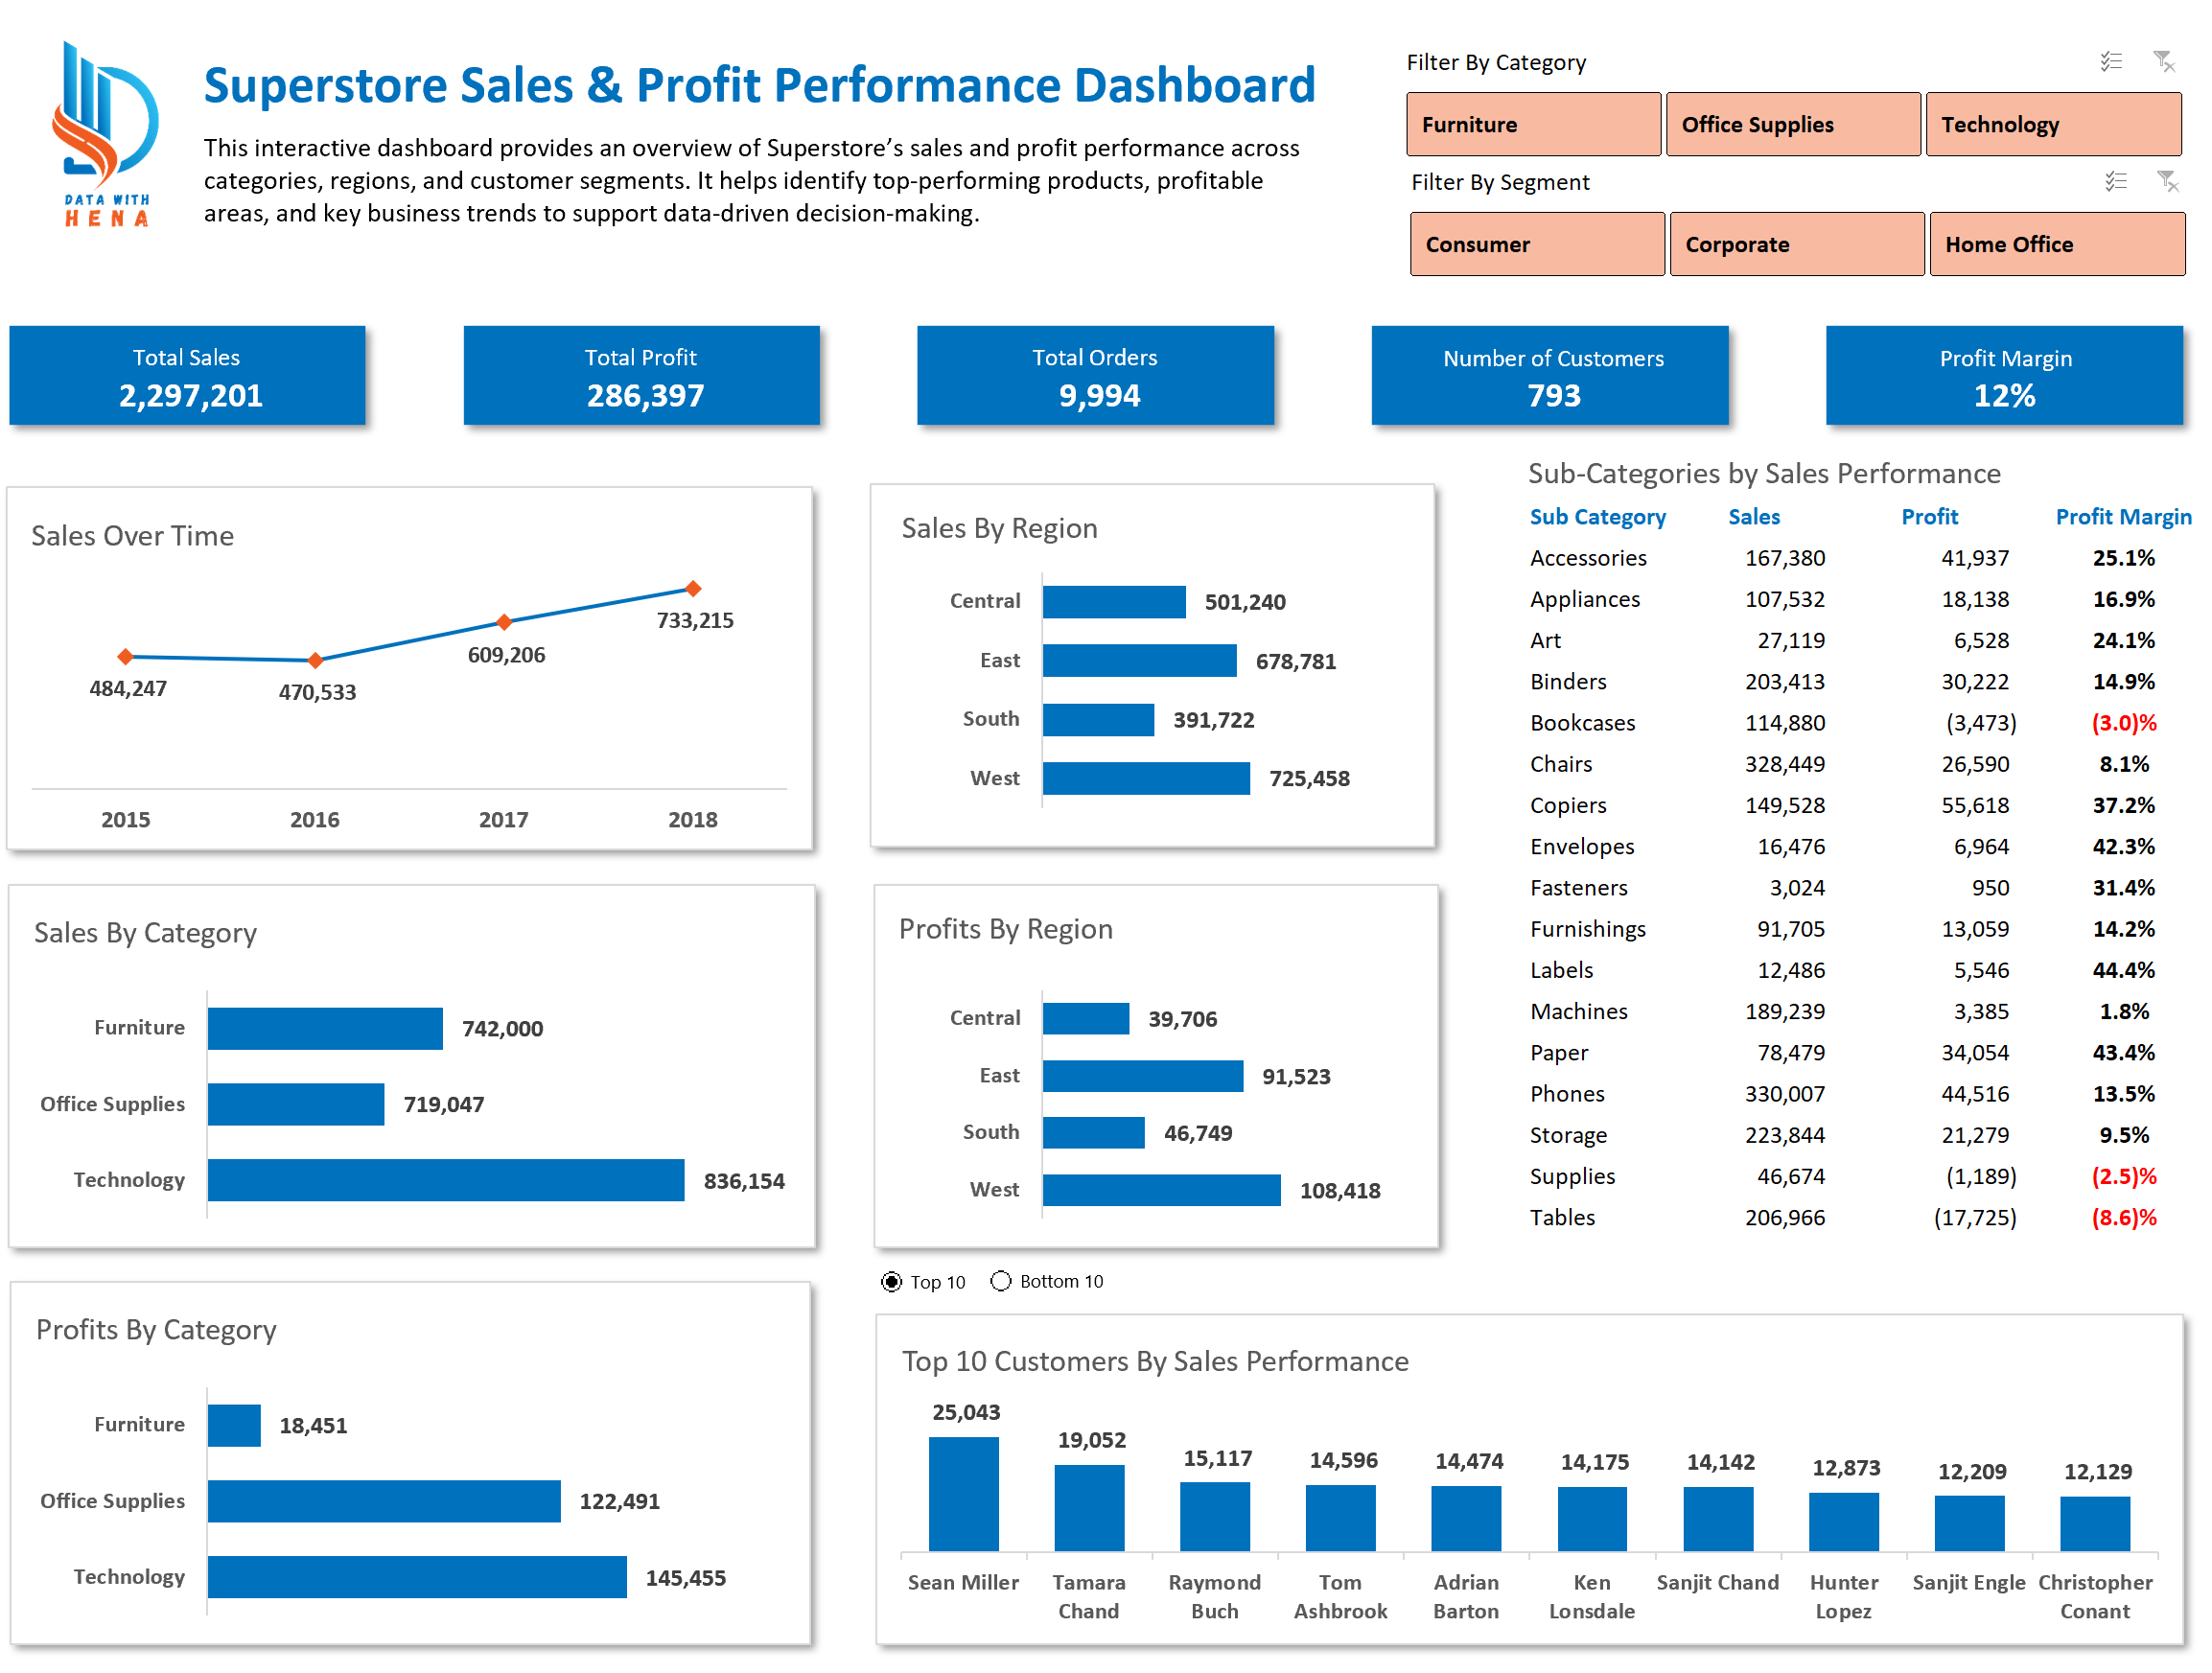
Superstore Sales & Profit Performance Dashboard
Problem: Business performance data was hard to track across categories, regions, and customer segments.
Tools: Microsoft Excel.
What I did: Designed an interactive dashboard for sales, profit, and trend analysis using structured visuals.
Key result: The dashboard quickly reveals top and low-performing areas for decision-making.
Global Happiness Trends Project
Problem: Global happiness drivers needed to be explained in a clear, evidence-based way.
Tools: Python, Kaggle, Tableau.
What I did: Analyzed World Happiness Report data, then translated findings into an interactive dashboard.
Key result: Key socio-economic factors and country-level patterns become easy to compare over time.
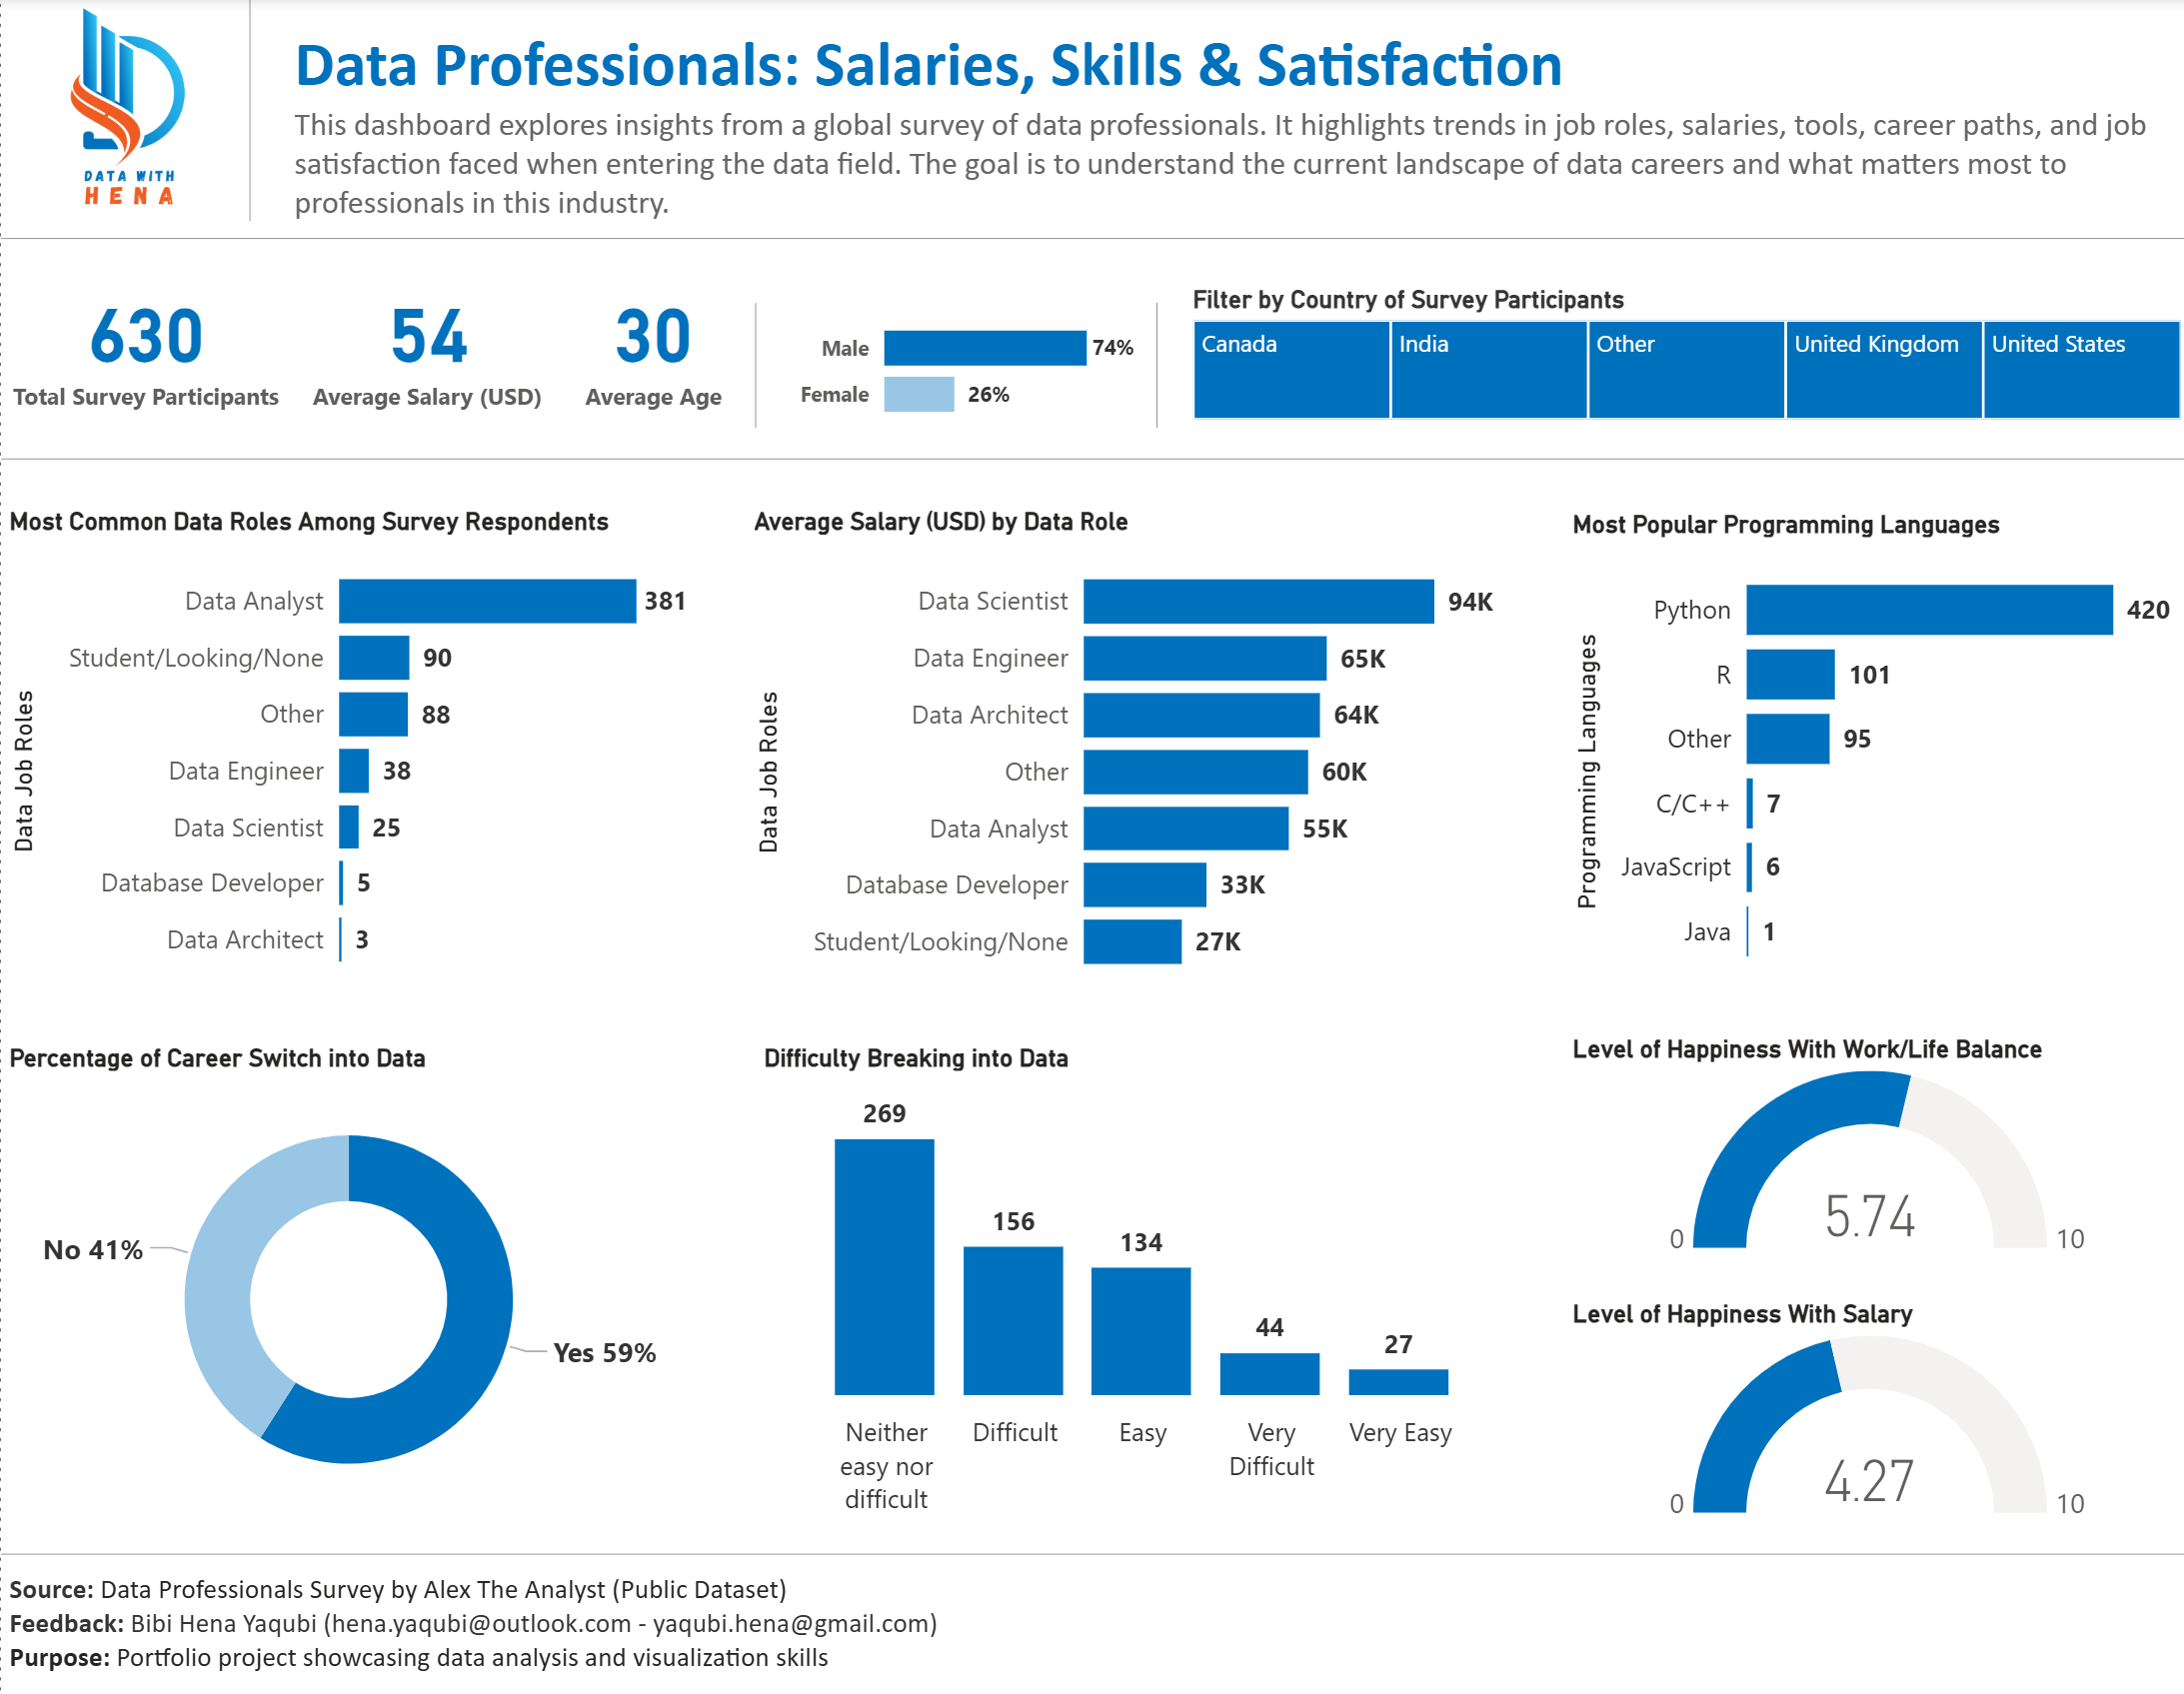
Data Professionals Survey Dashboard
Problem: Data professionals needed clearer insight into career trends, salary, and skills demand.
Tools: Power BI.
What I did: Built a survey dashboard covering roles, salaries, programming languages, and job satisfaction.
Key result: The report surfaces clear patterns in compensation and role-specific skill preferences.
What I Do
Data Analysis & Reporting
I analyze your data to uncover key insights, trends, and patterns, and deliver a clear, well-structured report that supports informed decision-making.
Dashboard Design & Development
I design interactive and visually clear dashboards that transform complex data into meaningful visuals, making insights easy to explore and understand.
Learn More
Data Report Refinement
I refine and structure your draft reports into polished, professional documents with clear insights, visuals, and data-driven storytelling.
 Learn More
1-on-1 Mentoring / Consulting
I help you with personalized mentoring to guide you through building dashboards and reports step by step. Sessions focus on practical design, clarity, and turning data into insights you can confidently present.
 Learn More
About Me

I am Hena Yaqubi, a data analyst focused on turning raw data into clear insights, dashboards, and reports that support better decision-making. I work with Excel, SQL, Tableau, Power BI, and Python to clean data, analyze trends, and present findings in a practical and understandable way. I am currently seeking opportunities in data analytics, reporting, and business intelligence where I can apply data to real-world problems. Alongside my professional work, I also share beginner-friendly data learning content through my YouTube channel.
Core Tools I Use

Excel

SQL

Tableau

Power BI

Python
Let's Work Together on Your Next Data Project
Have a project in mind or need help with data analysis, dashboards, or educational content? Let's talk.
Contact Me